Kubernetes delivers a plethora of metrics that provide insights into the status and performance of your pods, nodes and deployments. By effectively monitoring these indicators, you can guarantee that applications run smoothly, resources are optimally used, and potential issues are discovered and addressed as soon as possible.
The desired result is a Kubernetes environment that is strong, efficient, and reliable, allowing you to maximize uptime, improve performance, and maintain operational stability.
Measuring Application Observability
To achieve broad observability in Kubernetes, applications must be properly measured. This entails adding configurations and code snippets to collect relevant logs and metrics.
1. Logging
Logging is the initial step toward observability. It provides useful insights into the application’s activity and can help troubleshoot issues effectively. To collect logs from all pods, Kubernetes proposes a centralized logging system like ELK stack, Fluentd and Loki.
2. Metrics
Metrics provide quantitative information about an application’s performance. Kubernetes offers a variety of metrics via the Metrics API, which can be collected with tools such as Prometheus. Developers can also offer extra metrics specific to their apps by instrumenting their code.
Key Kubernetes Metrics to Monitor
Monitoring the overall health of your Kubernetes cluster is critical. Knowing how many resources your cluster uses, how many apps are operating on each node, and whether or not the nodes are operating at optimal capacity are all crucial. These are some key Kubernetes metrics to monitor:
- Node Resource Usage Metrics: Metrics such as disk and memory consumption, CPU usage, and network bandwidth can help you decide whether you need to change the number and size of nodes in the cluster. Monitoring memory and disk use at the node level gives critical information about your cluster’s performance and workload distribution.
- Number of Nodes: This measure tells what a cluster is used for and what costs are paid, especially when using cloud providers.
- Running Pods per Node: This statistic indicates whether the available nodes are adequately scaled and capable of handling the pod burden in the event of a node failure. This is crucial if you’re using pod affinity to limit pod scheduling depending on the node label.
- Memory and CPU Requests and Limits: These define the bare minimum and upper limit of resources that containers can get from a node’s kubelet. After taking into consideration the OS and Kubernetes system activities, allocatable memory is the amount of memory that is accessible for pods. These metrics let you know if the Control Plane can plan additional pods and if your nodes have enough capacity to manage the memory requirements of your present pods.
Optimizing Kubernetes Performance by Leveraging Key Metrics
Here are some best practices to optimize Kubernetes performance through leveraging the key metrics:
1. Right-Sizing Resource Allocation
To optimize resource allocation in Kubernetes, it is critical to understand each application’s requirements. By profiling your applications’ resource requirements, you can select the appropriate instance types and assign the proper amount of resources. This minimizes overprovisioning and underutilization, resulting in cost savings and higher performance.
2. Efficient Pod Scheduling

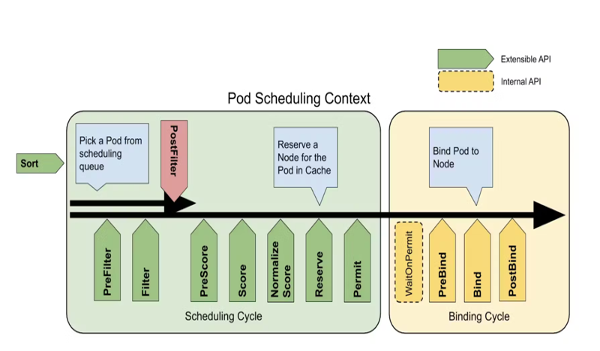
Efficient pod scheduling is critical to optimizing Kubernetes performance. You can use node affinity and anti-affinity rules to govern pod placement and guarantee that they are scheduled on the appropriate nodes based on your requirements. This helps spread the workload evenly throughout the cluster, maximizing resource efficiency.
3. Horizontal Pod Autoscaling
Depending on resource use, horizontal pod autoscaling (HPA) automatically adjusts a deployment’s replica count. You can guarantee that your apps have the resources to effectively manage varying workloads by putting autoscaling mechanisms into place and keeping an eye on resource use.
4. Optimizing Networking
Efficient networking is essential for peak Kubernetes performance. Consider several service topologies based on your application’s needs, such as ClusterIP, NodePort, or LoadBalancer. Each architecture has advantages and disadvantages in terms of performance, scalability, and external access. Load balancing solutions, such as round-robin or session affinity, have an impact on application performance and resource utilization. Choose the best load-balancing approach for your application based on its characteristics and traffic patterns.
5. Storage Optimization
Storage optimization in Kubernetes entails making strategic decisions about storage classes and persistent volume types. Choose the storage class that best meets your applications’ performance, durability, and cost needs. Different storage classes, such as SSD or HDD, give varying levels of performance and replication and backup capabilities.
Kubernetes Tools for Observability
Kubernetes includes built-in tools and features that help with observability and performance improvement.
- Kubernetes Dashboard: The Kubernetes Dashboard is a web-based interface that displays graphical representations of the cluster’s many components. It enables DevOps teams to monitor resource use, pod health, and deployments from a single dashboard.
- Prometheus: Prometheus is a well-known open-source monitoring tool that is frequently utilized in Kubernetes installations. In addition to gathering metrics from defined targets and storing them in a time-series database, it also offers robust querying and alerting features.
- Grafana: Grafana is a flexible data visualization tool that connects with Prometheus to create complete dashboards and alarms. This connection enables DevOps teams to efficiently monitor and analyze a diverse set of KPIs.
Conclusion
Observability is an important part of optimizing Kubernetes performance. By comprehending the significance of observability, instrumenting applications with appropriate logging and metrics, utilizing Kubernetes-native tools, and utilizing external observability tools like Prometheus and Grafana, DevOps teams can obtain important insights into their Kubernetes clusters, spot bottlenecks, and efficiently optimize application performance. With a well-managed Kubernetes environment, enterprises can ensure that their applications run smoothly and efficiently, resulting in improved user experiences and lower operational expenses.


